Power BI for Construction Companies in the UAE that Need Real-Time Project Visibility

Track project costs, timelines, procurement, workforce productivity, and KPIs with custom Power BI dashboards built for construction businesses operating across Dubai, Abu Dhabi, and the wider UAE.

Give project managers, finance teams, and site leads one shared view of every project in real time.
Projects shipped on time, on scope
0 +
Projects shipped on time, on scope
9 +
Clients, SMB to enterprise
60 +
Countries we have proudly served
15 +

Get Your Free Power BI Consultation

Tell us about your reporting challenges, and we’ll show you exactly what’s possible.

Power BI Success Stories 

What Power BI and Microsoft Fabric Can Do for Your Business

Power BI

Group 427319985

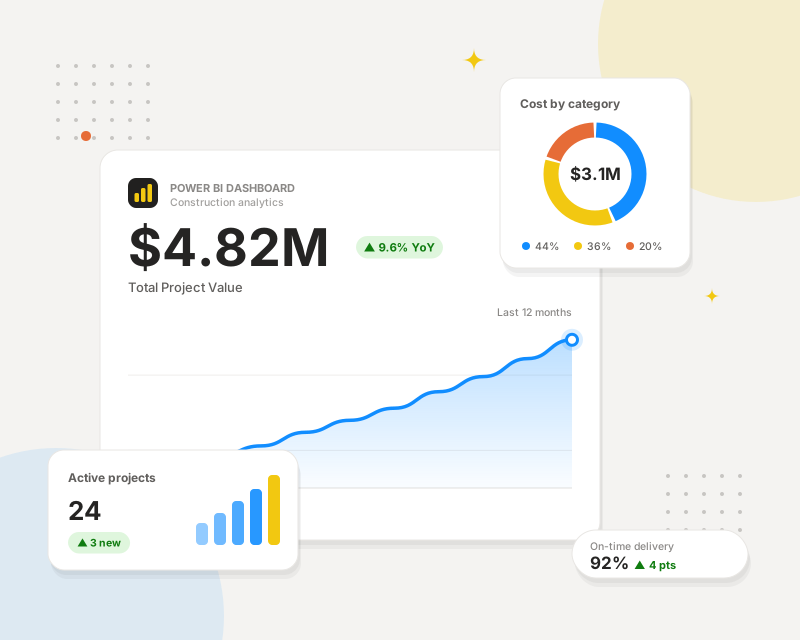
TechnoRUCS Power BI services help UAE construction companies transform scattered data into real-time dashboards that track costs, productivity, resources, and operations across projects, enabling every team to make faster, informed decisions with complete visibility into business performance.

Microsoft Fabric

fabric 24 color 1
Microsoft Fabric strengthens this by handling data engineering, storage, and analytics in one environment. For businesses managing large volumes of data across multiple sites, contractors, and systems, Fabric ensures dashboards always reflect accurate, current data rather than a manually refreshed export.
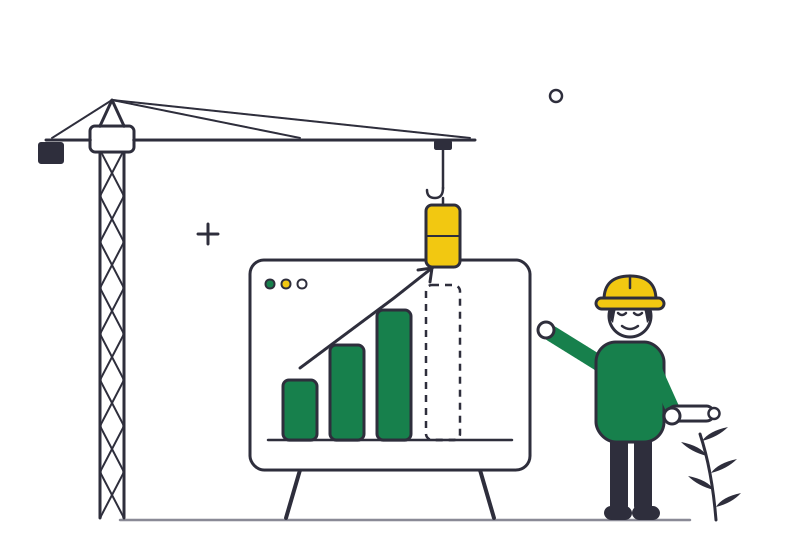
powerbi construction vector 1

What Power BI
Tracks Across Every Module 

01

Opportunities and pipeline 

Track total opportunities, contracts won, and deals lost. Monitor conversion rates and identify where pipeline follow-through is consistently breaking down. 

02

Projects

Monitor project status, production shift records, milestone completion, and document activity across your entire portfolio from one central dashboard. 

03

Timesheets and workforce 

Track total opportunities, contracts won, and deals lost. Monitor conversion rates and identify where pipeline follow-through is consistently breaking down. 

04

Customers and vendors 

Monitor contact records, location data, linked documentation, and activity history. Track vendor engagement and customer relationships alongside project activity. 

05

Equipment 

Track owned and rented equipment utilization through production shift logs. Monitor availability, idle time, and asset records across all project sites. 

06

Inventory 

Monitor material availability by item and unit across all projects. Flag shortfalls early so they do not stall on-site work or delay project timelines unnecessarily.

Power BI Dashboards Built for Construction

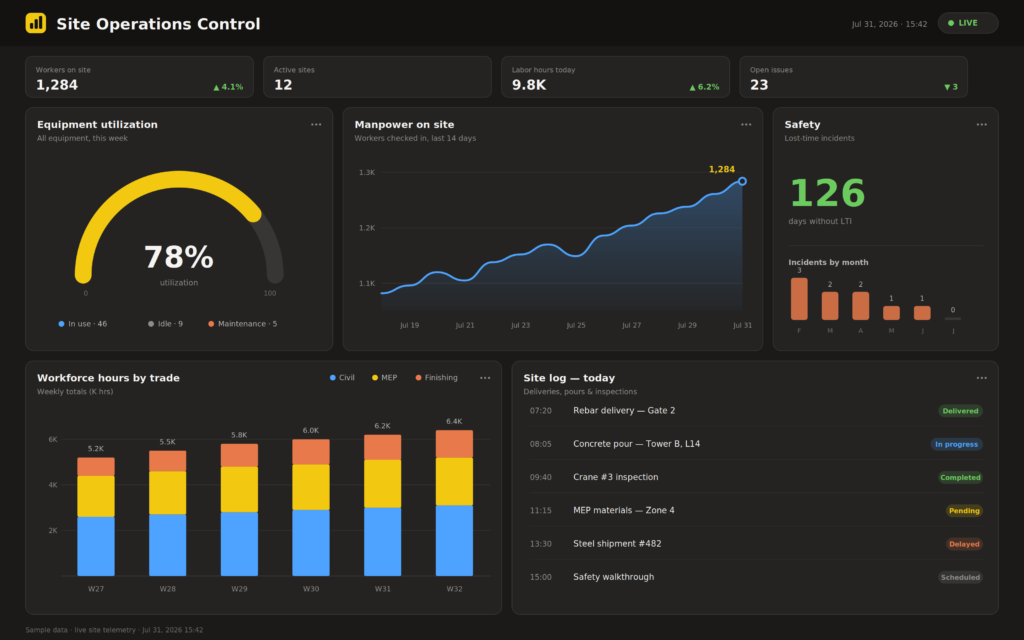
project performance dashboard

Project Performance Dashboard 

Get a live view of every project’s health in one place. Track milestone completion, progress percentages, timeline adherence, and early warning indicators for at-risk projects. Know exactly where each project stands without having to chase updates from site managers. 

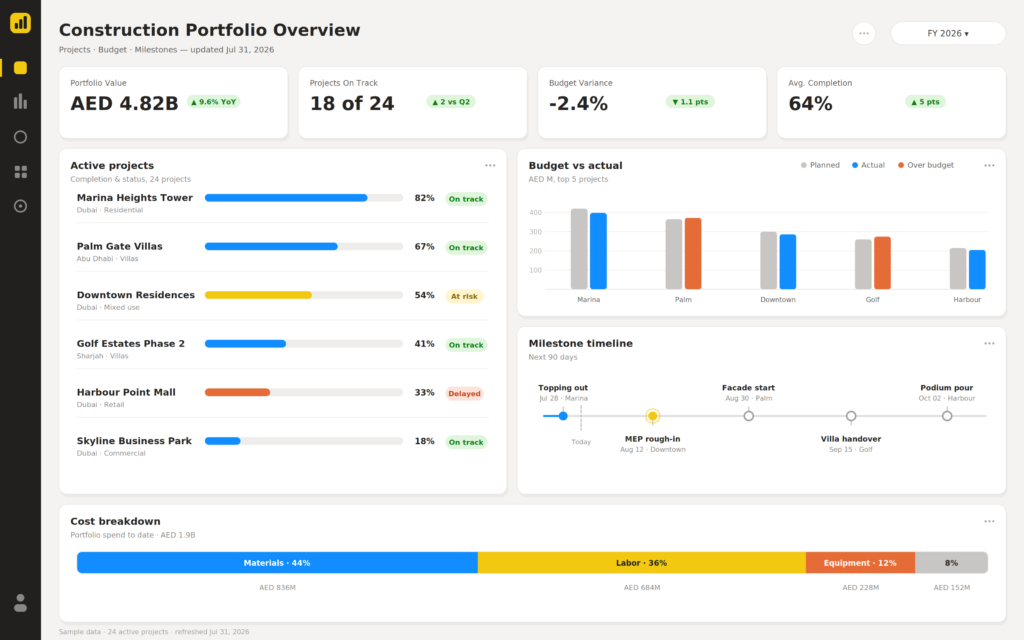
cost control dashboard

Cost Control
Dashboard 

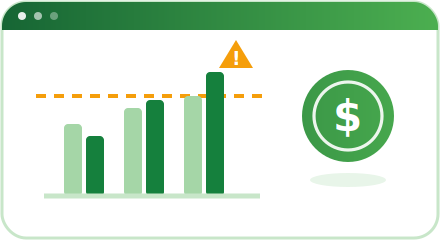
Monitor budgets, actual spending, committed costs, and cost overruns in real time. Compare planned vs. actual across projects and phases. Identify where spending is accelerating and take corrective action before it becomes a financial problem. 
procurement dashboard

Procurement Dashboard 

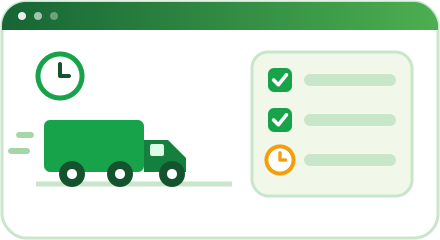
Track material requests, purchase orders, supplier timelines, and pending deliveries across projects. Identify bottlenecks in your procurement process, flag delayed orders, and keep construction schedules on track by ensuring materials arrive when needed. 
workforce dashboard

Workforce Dashboard 

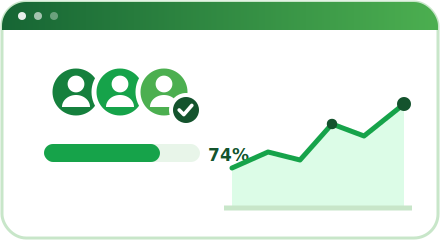
Measure manpower allocation, daily attendance, productivity by team, and site-level performance. Identify understaffed areas, monitor subcontractor output, and ensure the right people are deployed to the right projects at the right time. 
equipment dashboard

Equipment Dashboard 

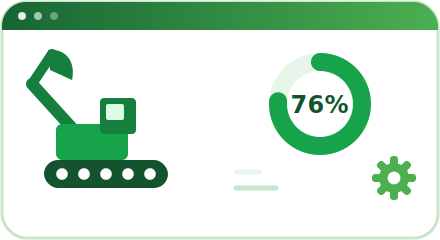
Monitor machine usage, idle time, downtime incidents, maintenance schedules, and overall utilization trends. Reduce unnecessary rental costs, plan preventive maintenance, and extend equipment life with data-backed decisions. 
executive dashboard 1

Executive Dashboard 

Give executives a high-level command view of the entire project portfolio. Revenue, profitability, risk flags, project health scores, and key KPIs all in one screen, updated in real time. Built for fast reads, not deep data exploration. 
icon building

Curious What Power BI Can Do?

Talk to our Power BI experts and get a free consultation tailored to your construction business in the UAE. 

Why Choose TechnoRUCS 

At TechnoRUCS, we structure every engagement around your actual data, your real workflows, and the decisions your teams need to make faster. We’ve delivered many Power BI solutions for enterprises across the UAE, giving us the experience to build reporting solutions that align with complex business operations. 

From integrating ERP systems, CRM platforms, Excel, SQL databases, and cloud applications to designing intuitive, custom dashboards, we deliver Power BI solutions that are easy to adopt and built to scale. Our phased implementation approach, combined with training and ongoing support, ensures your teams continue to get value long after go-live.

Group 427319986

Resources

Frequently Asked Questions

Yes — D365 Finance & Operations is built for multi-site operations with complex supply chains. We’ve deployed it across two mine sites at McEwen Mining (Ontario and Nevada). The licensing model scales sensibly for mid-market mining companies, and the configuration depth handles everything from procurement to asset management without custom development for most workflows.

A single-site D365 implementation runs 12–16 weeks from kick-off to live environment using our five-stage process: Discover, Design, Implement, Test & Validate, Train & Handover. Multi-site rollouts run 16–24 weeks depending on geographic spread and the number of integrations. We size each engagement to your actual operational complexity — not a generic template.

Consulting is the project work — configuring D365 to your operations, integrating RFID and Power Platform, training your teams. Managed services is the ongoing operational support after go-live: user access reviews, configuration drift correction, security policy maintenance, and licence optimisation. We offer both, but they’re optional — many clients self-manage after handover using the documentation we provide.

Consulting is the project work — configuring D365 to your operations, integrating RFID and Power Platform, training your teams. Managed services is the ongoing operational support after go-live: user access reviews, configuration drift correction, security policy maintenance, and licence optimisation. We offer both, but they’re optional — many clients self-manage after handover using the documentation we provide.

Need expert help with Power BI

Talk to our experts about your Power BI requirements today. 

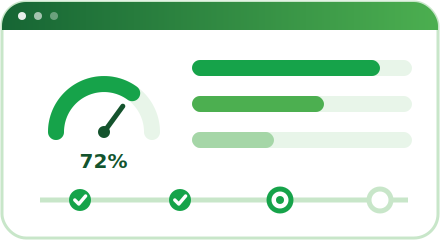
construction infographic

Get Your Free Power BI Consultation

Tell us about your reporting challenges, and we’ll show you exactly what’s possible.
TechnoRUCS Final
image 13
image 14
Microsoft Solutions Partner and Salesforce Consulting Partner. Headquartered in Chennai, India.

Solutions

Services

Company

Get in touch

Get Your Free Power BI Consultation

Tell us about your reporting challenges, and we’ll show you exactly what’s possible.